


Voodoo Figure 4. The End of the Age of America
Emerging and developing economies have grown to account for about two-thirds of the world’s central bank holdings of foreign exchange reserves as their relative holdings of U.S. dollars have quietly gone in the opposite direction… Increasingly, bi-lateral trade agreements among other nations exclude the use of the U.S. dollar as payment for international trade, once the domain of the U.S. dollar as the world reserve currency. Other countries see what is unfolding in this country but it is unclear if the American public sees it. — Quantitative Easing 0-1-2-3∞ & The Federal Reserve’s Love Affair with its Banks and Mortgage Bonds: Levitating The Black Hole (Oct. 22, 2012)
These developments can be seen in Figure 1, as China is the primary driver of the group of emerging and developing (E & D) economies. Government central bank foreign exchange reserves (Forex), also call official international reserves, consist of foreign cash and bonds. In this context, think of Forex reserves as a component of a country’s ‘savings’ from production; part of the composition of savings are the currencies central banks hold, U.S. dollars being the world reserve currency, and to a lesser degree euros, yen, and pound sterling. The size of the Forex reserve and its composition of currencies may give an indication of a country’s growth and weighting of its import-export production, savings or indebtedness, its ability to influence exchange rates or confidence about currencies.
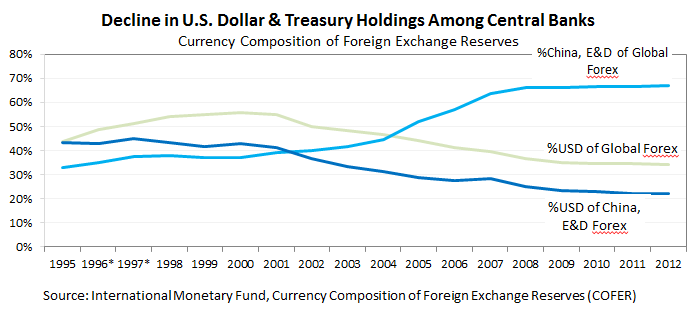
Voodoo Figure 1. Decline in U.S. Dollar & Treasury Holdings among Central Banks, 1995-2012
In just eight years from about 2000 to 2008, China in leading the E&D economies, nearly doubled its share of global central bank foreign currency reserves to now hold two-thirds of the world’s currency reserves ‘savings’ as seen in Voodoo Figure 1. In the U.S. by 2008, the worst banking and financial collapse in a century (perhaps a few) continues to unfold. From 1995 to 2012,
- China and the E&D economies reduced relative holdings of U.S. dollars by about half (slightly over 40% to 20%) quietly over the past 18 years, but a striking difference is
- advanced economies held on at about 60% of its Forex in U.S. dollars (not shown in the chart) as its share of global foreign currency reserves plunged from two-thirds to about one-third.
Let’s look at what is behind these rapid shifts from the two countries leading these changes, shown in Figure 1 to Figure 2. An important determinant of the increase in central bank foreign reserves is driven by the country’s productivity, so we look at trade. Countries trade in both goods and services but the focus is on manufacturing as the value of manufacturing goods accounts for over two-thirds of U.S. and over 90% of China’s exports in 2011. From the available data in Figure 2, for about 25 years China’s share of world manufacturing output appear dormant until about 1995, when it began to rise to match its growing share of global central bank Forex reserves (more detail in Figure 3).
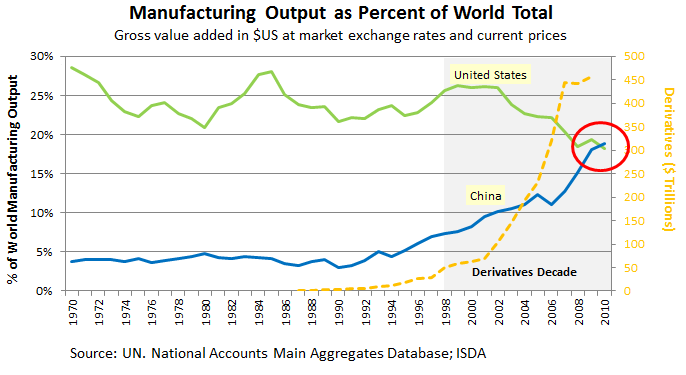
Voodoo Figure 2. The Decade of Financial Derivatives of the Largest Member Banks of the Federal Reserve System: The Rise of China. The derivatives data from ISDA (IRS, CDS, currency swaps) is for illustration purposes and is incomplete, as there are over $1,000 trillion in notional derivatives outstanding. Following the collapse in 2008, there was a re-valuation of derivatives by the IMF and BIS and similarly a change in the valuation of bank balance sheets by FASB’s suspension of mark-to-market rule in 2009. QE & The Federal Reserve’s Love Affair showed the effects of FASB. Derivatives are financial contract instruments based on or whose value is ‘derived’ from the underlying value of an asset, at least that is the definition.
Perhaps there was a random confluence of events in the late 1990s from what we can observe. Banking laws were changed (Gramm-Leach-Bliley Act of 1999 also known as the Financial Services Modernization Act of 1999) to allow the largest banks unlimited growth, risk and leverage in concert with then-Former Federal Reserve Chairman Alan Greenspan, Robert Rubin and Lawrence Summers, on behalf of the largest banks, prevented regulation of the opaque OTC (“Over-the-Counter”) for the derivatives market to grow to over $1,000 trillion in notional value. Most of it, curiously, is in interest rate swaps that we will look into next.
(This is not to say that U.S. policies did not affect its competitiveness, but it was only earlier in 2012 that Congress banned itself from insider trading after the issue came to light in 2004. Among many, a Congressman after a secret briefing by the U.S. Treasury and Federal Reserve a few days before the financial meltdown in September 2008 bought stock options the following day as the American public saw $7 trillion in home equity evaporate and their median net worth declined by 40%).
As a handful of the largest member banks of the Federal Reserve became the world’s leading manufacturer of financial derivatives based on assets and capital that do not exist, the U.S. share of world manufacturing output began to fall in 2002, coinciding with China’s ascension to the World Trade Organization (WTO) year-end December 11, 2001.
Starting in 2002 from Voodoo Figure 2, derivatives began to go vertical, but it was the interest rate swaps (IRS) that exploded. The $62 trillion in credit default swaps was perhaps a mere 10% compared to the IRSs, which presumably were used to hold down interest rates to inflate the housing market, among other things. In my previous post, QE and the Federal Reserve’s Love Affair, there were early indications of systemic problems by 2003 by a striking jump in the largest banks’ holdings of U.S. Treasury bonds presumably to stay capitalized, followed by MERS (Merscorp’s) commissioned letter in 2004 about its legal validity in securitizing $7 trillion (likely more) in mortgage bonds that were wrapped in even more derivatives. Mid-2006 saw presidential powers delegated for the first time outside the Oval Office to the intelligence czar to exempt firms from financial disclosures, followed by the banking and financial system collapse in fall 2008.
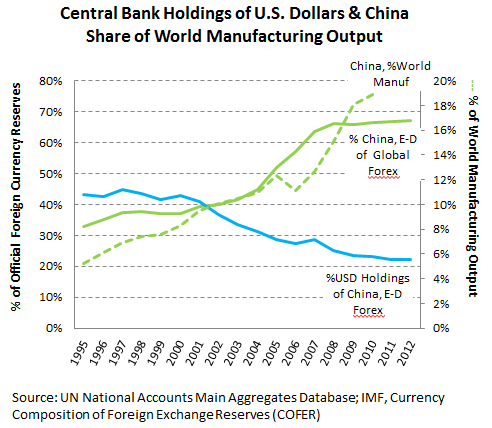
Voodoo Figure 3. What China was Doing during the Derivatives Decade
Without much fanfare, China surpassed the United States as the world’s leading manufacturer in 2010, as can be seen in Voodoo Figure 2 and maintained the lead in 2011. In 2011 China’s GDP (in purchasing power parity, PPP) was $11.3 trillion and the U.S. $15 trillion. On the data about China’s dependence on the U.S. market, U.S. dollars and Treasury holdings as can be seen in Figure 3,
- 21.4% of China’s exports went to the U.S. in 2005, declining to 17.1% in 2011 as China’s share of world manufacturing output grew, and
- for the past 18 years, China leading the E&D economies cut relative holdings of U.S. dollars and bonds in half to a little over 20%.
- 35 of the largest U.S. multinational companies added nearly 3 times more jobs abroad than they did in the states, as per capital income grows in Asia.
The Dawn of a New Century
But there isa bigger picture, a no less than historic shift approaching. The last chart is a repeat of Voodoo Figure 1 with manufacturing in light dotted lines, superimposed by the United States’s and China’s share of world GDP over time. The big picture can leave one speechless. The first red circle was when China became the world’s largest manufacturer in 2010. The second red circle marks according to the IMF, the approximate time frame China will become the world’s economic power, ending America’s reign of the past century and what it portends for the U.S. dollar as the world reserve currency and all its implications.
Voodoo Figure 4. The End of the Age of America, 2016-2017
It makes one pause to put into context the confluence of events in this trajectory as derivatives were built into the largest financial institutions and largest market possible in housing, and more generally, the entire derivatives structure. Quantitative Easing 0-1-2-3∞& The Federal Reserve’s Love Affair looked at the unstated reasons for why the entire system is being levitated from The Black Hole. The Federal Reserve’s QE 3 in September 2012 is to essentially print unlimited dollars, but it is unclear how it will change this trajectory as time becomes increasingly finite. Against this trajectory, it almost makes currency wars seem a distraction, but for the destabilizing effects of rising prices for countries such as in the Middle East and Asia, where a significant portion of the population’s incomes is spent on food and fuel. And even then, it is unclear if it changes this trajectory.
The previous post is Russia’s President Putin remarks in Munich, Germany in 2007 before world leaders on issues of international security and the move away from a “unipolar world” to a “multi-polar world” as emerging and developing economies grow.
VIDEO: Former President of the World Bank(1995-2005), James Wolfensen, spoke before graduate students at Stanford University on January 11, 2010 about the economic re-balancing taking place in the world. He spoke about the neglect of the richer countries in the development of Africa even for their own self-interests that has been taken up by China, the developed countries’ financial crisis, the “tectonic shifts” and what that looks like for future generations.
Mr. Wolfensen speaks for the first 25 minutes followed by questions and makes some interesting remarks throughout, including:
“When the economic crisis hit, it moved very quickly from a G-8 issue to a G-20 issue and now the G-8 is part of the past…
The weighting of the planet is now moving in different directions…These are not trivial changes in the outlook. These are tectonic shifts in terms of the way the planet works…It is not something that is going to be turned back. It is something that will happen. It may not happen linearly. There may be events that will occur that will disrupt it to 3 years or 5 years… but directionally it is very clear.” (2010)