Beyond Quantitative Easing 0-1-2-3∞ & The Federal Reserve’s Love Affair: Is It Really Over?

The End of the Age of America, 2016-2017; The Age of China and Asia

Voodoo Figure 4. The End of the Age of America

Emerging and developing economies have grown to account for about two-thirds of the world’s central bank holdings of foreign exchange reserves as their relative holdings of U.S. dollars have quietly gone in the opposite direction…  Increasingly, bi-lateral trade agreements among other nations exclude the use of the U.S. dollar as payment for international trade, once the domain of the U.S. dollar as the world reserve currency. Other countries see what is unfolding in this country but it is unclear if the American public sees it. — Quantitative Easing 0-1-2-3∞ & The Federal Reserve’s Love Affair with its Banks and Mortgage Bonds: Levitating The Black Hole (Oct. 22, 2012)

These developments can be seen in Figure 1, as China is the primary driver of the group of emerging and developing (E & D) economies. Government central bank foreign exchange reserves (Forex), also call official international reserves, consist of foreign cash and bonds. In this context, think of Forex reserves as a component of a country’s ‘savings’ from production; part of the composition of savings are the currencies central banks hold, U.S. dollars being the world reserve currency, and to a lesser degree euros, yen, and pound sterling. The size of the Forex reserve and its composition of currencies may give an indication of a country’s growth and weighting of its import-export production, savings or indebtedness, its ability to influence exchange rates or confidence about currencies.

Decline in U.S. Dollar & Treasury Holdings among Central Banks, 1995-2012

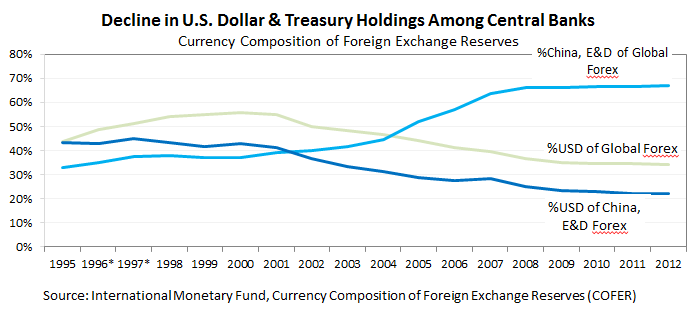
Voodoo Figure 1. Decline in U.S. Dollar & Treasury Holdings among Central Banks, 1995-2012

In just eight years from about 2000 to 2008, China in leading the E&D economies, nearly doubled its share of global central bank foreign currency reserves to now hold two-thirds of the world’s currency reserves ‘savings’ as seen in Voodoo Figure 1. In the U.S. by 2008, the worst banking and financial collapse in a century (perhaps a few) continues to unfold. From 1995 to 2012,

  • China and the E&D economies reduced relative holdings of U.S. dollars by about half (slightly over 40% to 20%) quietly over the past 18 years, but a striking difference is
  • advanced economies held on at about 60% of its Forex in U.S. dollars (not shown in the chart) as its share of global foreign currency reserves plunged from two-thirds to about one-third.

Let’s look at what is behind these rapid shifts from the two countries leading these changes, shown in Figure 1 to Figure 2. An important determinant of the increase in central bank foreign reserves is driven by the country’s productivity, so we look at trade. Countries trade in both goods and services but the focus is on manufacturing as the value of manufacturing goods accounts for over two-thirds of U.S. and over 90% of China’s exports in 2011.  From the available data in Figure 2, for about 25 years China’s share of world manufacturing output appear dormant until about 1995, when it began to rise to match its growing share of global central bank Forex reserves (more detail in Figure 3).

The Western Derivatives Decade: Decline of U.S. Manufacturing as China Rises

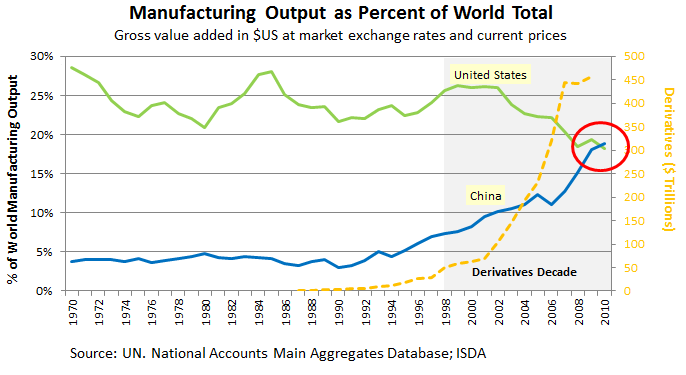
Voodoo Figure 2. The Decade of Financial Derivatives of the Largest Member Banks of the Federal Reserve System: The Rise of China. The derivatives data from ISDA (IRS, CDS, currency swaps) is for illustration purposes and is incomplete, as there are over $1,000 trillion in notional derivatives outstanding. Following the collapse in 2008, there was a re-valuation of derivatives by the IMF and BIS and similarly a change in the valuation of bank balance sheets by FASB’s suspension of mark-to-market rule in 2009. QE & The Federal Reserve’s Love Affair showed the effects of FASB. Derivatives are financial contract instruments based on or whose value is ‘derived’ from the underlying value of an asset, at least that is the definition.

Continue reading

Quantitative Easing 0-1-2-3∞ & The Federal Reserve’s Love Affair with its Banks and Mortgage Bonds: Levitating The Black Hole

“A black hole is a region of spacetime where gravity prevents anything, including light, from escaping… Around a black hole there is a mathematically defined surface called an event horizon that marks the point of no return.”—Wikipedia

When Did QE Stop?

To much frenzied media coverage, the Federal Reserve Bank announced a third round of quantitative easing “QE 3“ on September 13, 2012. The Federal Reserve will essentially print unlimited quantities of dollars to purchase agency mortgage bonds and maintain nominal interest rates targeted at 0% (“ZIRP”) to keep borrowing costs reasonable for its member banks, among others.

“QE 3” in 2012 is the unlimited version of “QE 1” in 2009 following the banking and financial system crisis in September 2008. What does this mean?

QE is simply the printing of dollars in paper or digital form by the quasi-private Federal Reserve Bank, as the Federal Reserve does not have this money. In QE 1 (web), the Federal Reserve Bank printed $1.25 trillion to purchase agency mortgage-backed securities (MBSs). Agency MBSs are mortgage bonds (akin to a mutual fund filled with mortgages, peoples’ homes) issued and guaranteed or held by the quasi-private Fannie Mae and Freddie Mac.

On a practical level this means the Federal Reserve Bank printed $1.25 trillion with a computer stroke and became the owner or recipient of homeowners’ mortgage payments.  The Federal Reserve will do this on an unlimited basis in QE 3 going forward, as it states ‘to foster maximum employment and price stability’.

What is it about the Federal Reserve Bank’s love affair with mortgage bonds that the media and the Federal Reserve will not speak of?

 I.  QE0: Insolvency of the Largest Banks in the Federal Reserve System

Let’s pause for a moment. The most significant QE was not even called QE. It was the suspension of the Financial Accounting Standards Board’s (FASB) mark-to-market accounting rule 157 in April 2009. The rule required banks to value assets on their balance sheets at current market price or fair value, but since 2009, became what the banks hope it is worth or what they paid for it.

Doing so helps insolvent banks avoid the appearance of insolvency by not having to write-down the amount of losses on assets, such as mortgage bonds, assuming there is a willing buyer (There isn’t really). Private sector financing for the housing market through demand for private label MBSs, which are mortgage bonds backed by mostly subprime mortgages reincarnated as prime issued and sold by the largest banks, collapsed since fall 2008.

Let’s give this FASB suspension of mark-to-market accounting event a name, QE0 , to mark the point of no return in April 2009 about six months after the banking and financial collapse in September 2008.

Following the collapse, lawmakers in the U.S. House of Representatives lined up to threaten FASB in a series of hearings to suspend mark-to-market accounting, as Representative Michael E. Capuano (D-Mass.) warned FASB’s chairman in March 2009: “Do not make us tell you what you have to do.” (Transcript of the U.S. House of Representatives Mark-to-Market Hearing, March 12, 2009). The American Bankers Association, Citigroup, and the Bank of New York Mellon Corp., the world’s largest custodian of financial assets, also pressured for the rule change (web).

[On a side note:  MIT finance professor-CBO chief economist revised my memo to say that assets may already fully reflect market values. After I was fired I learned that MIT Professor Deborah Lucas called by the U.S. President to CBO in 2009 (web) has a CBO economist sit on FASB. This CBO economist and CBO Director Elmendorf are part of the Hamilton Project at the Brookings Institution. Robert Rubin is the project’s founder and Dr. Lawrence Summers, once chief advisor to the U.S. President, sits on its Advisory Council to promote economic growth and health care. Former Federal Reserve Bank Chairman Alan Greenspan, Robert Rubin, and Lawrence Summers were instrumental in the proliferation of derivatives in the late 1990s. ]

Let’s look at a few simple charts. What does QE0 FASB look like for the largest banks?

Voodoo Assets and Liabilities Chart 1:U.S. Commercial Banks Net Worth: Assets minus Liabilities - Can you spot the banking and financial crisis?

From Voodoo Chart 1, was there a banking and financial crisis in 2008 that froze global markets? From the crisis in fall 2008 to 2009, there is no change between assets and liabilities! No change, for what has been considered the worst banking and financial crisis in a century (a few?). Continue reading